Consultancy and Programming
Technical Pages
About Us

By Linda Bass
A question that often comes up in Crystal Reports forums and newsgroups is: How can I create a calendar-style report? Typically, the requirement is to create a report showing appointments or bookings on a day-by-day basis, just as they would appear in a calendar or month planner. Figure 1 shows a typical example. This has a square for each day, with each month on a separate page.
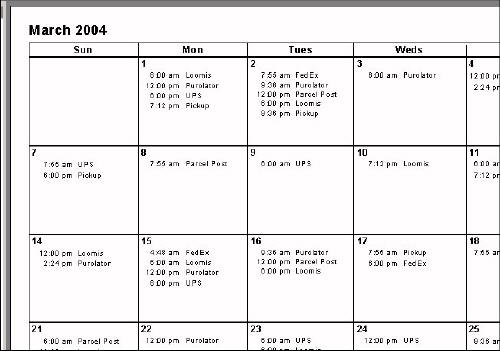
Figure 1: The report mimics a conventional calendar.
In this article, I'll explain how to create this type of report. I'll also give you a link for downloading a sample report that illustrates the technique.In order to create this type of report, you will need to add a simple calendar table to your database. As a minimum, this table consists of one column, with a row for each day of the year to which the calendar will apply. The rows contain consecutive dates within the year.
If you are unable to add tables to your main database, don't worry. You can easily set up the table in Excel. To do so, enter the date of the first day of the year in cell A1. Then drag the fill handle (the small square in the bottom right corner of the cell) downwards until you have created a range of dates for the entire year - or for as many years as you like. Figure 2 shows how this might look.
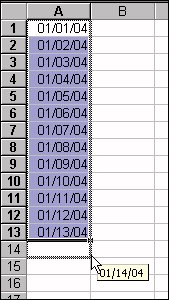
Figure 2: Creating the calendar table in Excel
You will also need a table containing the appointments, bookings or other data that you want to appear in the calendar. This table will need a date column, plus a column containing the text that you want to display in the calendar. There is no problem in having more than one appointment for a given day, provided there is enough space in the day square (in this article, I will refer to the data as appointments, but the technique will work equally well with room bookings, rental reservations, or anything similar.)
Having identified your tables, the next step is to start a new report. Add the date table to the report. Then proceed as follows:
1. Change the page orientation to landscape. To do so, open the Page Setup dialog from the File menu (or, depending on your version of Crystal Reports, the File / Print menu), then choose the Landscape option.
2. In the report, insert a group based on the date field. In the control labeled 'This section will be printed for', pick 'For each month'. Check 'Use customized group name based on a formula' and enter the following formula (using your own table and field names in place of xl and date):
Monthname(Month({xl.date}))
3. Insert a new Page Header section, and drag the group name to the Page Header_a section. Open the Section Expert, select the Group Header #1 section, and check Suppress. Then select the Group Footer #1 section, and check New Page After. In the formula area, enter this formula:
Not OnLastRecord
4. Create a formula called {@Weeknumber}:
DatePart("ww",{xl.date})
5. Insert a new group (Group #2), based on this {@Weeknumber} formula. Right-click in the gray area to the left of the main report area, and select 'Insert section below'. There should now be a Group Header #2a section and a Group Header #2b section. Open the Section Expert, select the Group Footer #2 section, and check Suppress.
6. Create seven formulas, one for each day of the week. Name them {@Sun}, {@Mon} and so forth. The {@Sun} formula should look like this:
if DayOfWeek({xl.date}) = 1 then Day({xl.date})
For the other six formulas, change the '1' to '2' (Monday), '3' (Tuesday), '4' (Wednesday), etc.
7. Place each of these seven formulas in the Details section. Arrange these in a horizontal row, starting with the formula for Sunday and continuing across the page in sequence.
Note: If you want a different day to be the first of the week, you will need to add the FirstDayOfWeek argument wherever the DayOfWeek and DatePart functions are used in both the main and subreports.
8. For each of the formulas, insert a summary, based on the Maximum function. Drag the summaries to the Group Header #2a section, positioning them equidistant across the page. Drag the lower boundary of Group Header #2b downward until it is the size that you want to allocate to the day square.
9. Suppress the Report Header, Details, Page Footer, and Report Footer sections.
10. To eliminate results of '0,' go to the Format Editor of each of the summaries in turn. On the Number page, choose Customize and check Suppress if Zero.
11. Next, create the following two SQL expressions, named {%Month} and {%Year} respectively, which we'll use for linking the subreports:
Month(`xl`.`date`)
Year(`xl`.`date`)
Note that you could use formulas instead of SQL expressions, but the use of SQL expressions will allow your report to run faster.
12. If your Excel table contains dates for more than one calendar year, create a number parameter, {?Year}. and then add the following record selection formula to the main report:
{%Year} = {?Year}
If you would like the report to show a calendar for one month only, you can create a number parameter for the month and add a second clause to the selection formula:
And {%Month} = {?Month}
13. Next, place a box over Page Header_b and extend this downwards to the bottom of the Group Header #2b section. Then add vertical lines extending from the top of the box to the bottom to divide the days, and add a horizontal line along the top of Group Header #2a to divide the weeks.
14. For both the box and the vertical lines, open the Format Editor and check the box labeled 'Extend to Bottom of Section when Printing.'
15. Left-justify and reposition the summaries (in Group Header #2a) so they are in the upper left corner of each day box, as you would normally see them in a calendar. In Page Header_b, position the column labels ('Sun', 'Mon', etc.) so that they are centered above each square.
At this point, you should see an empty calendar, with one month per page. So far, the steps I have described have been completely generic. You can use them to create the basic calendar grid for a given year, regardless of the data that you want to appear within the calendar.
For the next steps, we will add the actual data. To do this, we need to create a series of subreports.
16. Create a subreport called 'Sun' (choose Insert / Subreport / Create a Subreport). Select the appointment table (or whatever other table(s) hold your data). In the sample report accompanying this article, I used the Orders table from the Xtreme database, and I created a time formula to substitute for the actual {Orders.Order Date}, which always shows time as midnight, in order to create times throughout the day.
17. Add the field(s) containing the descriptions that you want to appear in the calendar. You can add as many fields as you like here, provided you have enough space. For example, you might add one field containing a description of the appointment, and another holding the appointment's start time. Add these fields to the Details section of the subreport, and suppress all other sections. Add a record sort by your time field, if you are using one.
18. Still in the subreport, create a formula called {@WeekNumber}:
DatePart("ww",{Appointments.Appointment Date})
19. Also create three SQL expressions in the subreport, using the delimiters appropriate to your database or connectivity, and naming them as indicated here:
{%DayOfWeek}:
{fn dayofweek(`Appointments`.`Appointment Date`)}
{%Month}:
Month(`Appointments`.`Appointment Date`)
{%Year}:
Year(`Appointments`.`Appointment Date`)
20. In the record selection formula of the subreport, add the following:
{%DayOfWeek} =1 // 1 = Sunday
21. Link the subreport to the main report using the {@Weeknumber} formula from each, and also linking {%Year} to {%Year} and {%Month} to {%Month}. Then place the subreport in the Sunday square of Group Header #2, resizing it to fit. Right-click on the subreport, choose Format Subreport, select the Border page, and change the four line styles to 'None'.
22. Repeat steps 16 to 21 for each of the other days of the week, taking care to substitute the correct day number in the record selection formula in each case.
23. Finally, make any cosmetic changes that are required. For example, you might add further horizontal or vertical lines or adjust the fonts or colors.
The download files accompanying this article include an Excel spreadsheet containing the calendar table and a calendar report showing shippers from the Xtreme database that accompanies Crystal Reports XI. The database has data for 2003 to 2005 (although only for some months in 2003 and 2005), so the Excel spreadsheet only includes those years.
To download the files, click on the link below. Unzip the resulting files into a folder of your choice. Then just run the report. The total download size is under 420 KB.
Linda Bass works in workforce development in Cambridge, MA, and is a regular contributor to Tek-Tips. If you have any feedback on this article or questions on the calendar report, please post them to the Business Objects: Crystal Reports 4 Other Topics forum at www.Tek-Tips.com.
Mike Lewis Consultants Ltd. March 2004.
Revised and updated August 2008.
These pages are maintained by Mike Lewis Consultants Ltd. as a service to the CR community. Feel free to download and use any code or components, and to pass around copies of the articles (but please do not remove our copyright notices or disclaimers).
The information given on this site has been carefully checked and is believed to be correct, but no legal liability can be accepted for its use. Do not use code, components or techniques unless you are satisfied that they will work correctly in your applications.
© Copyright Mike Lewis Consultants Ltd.